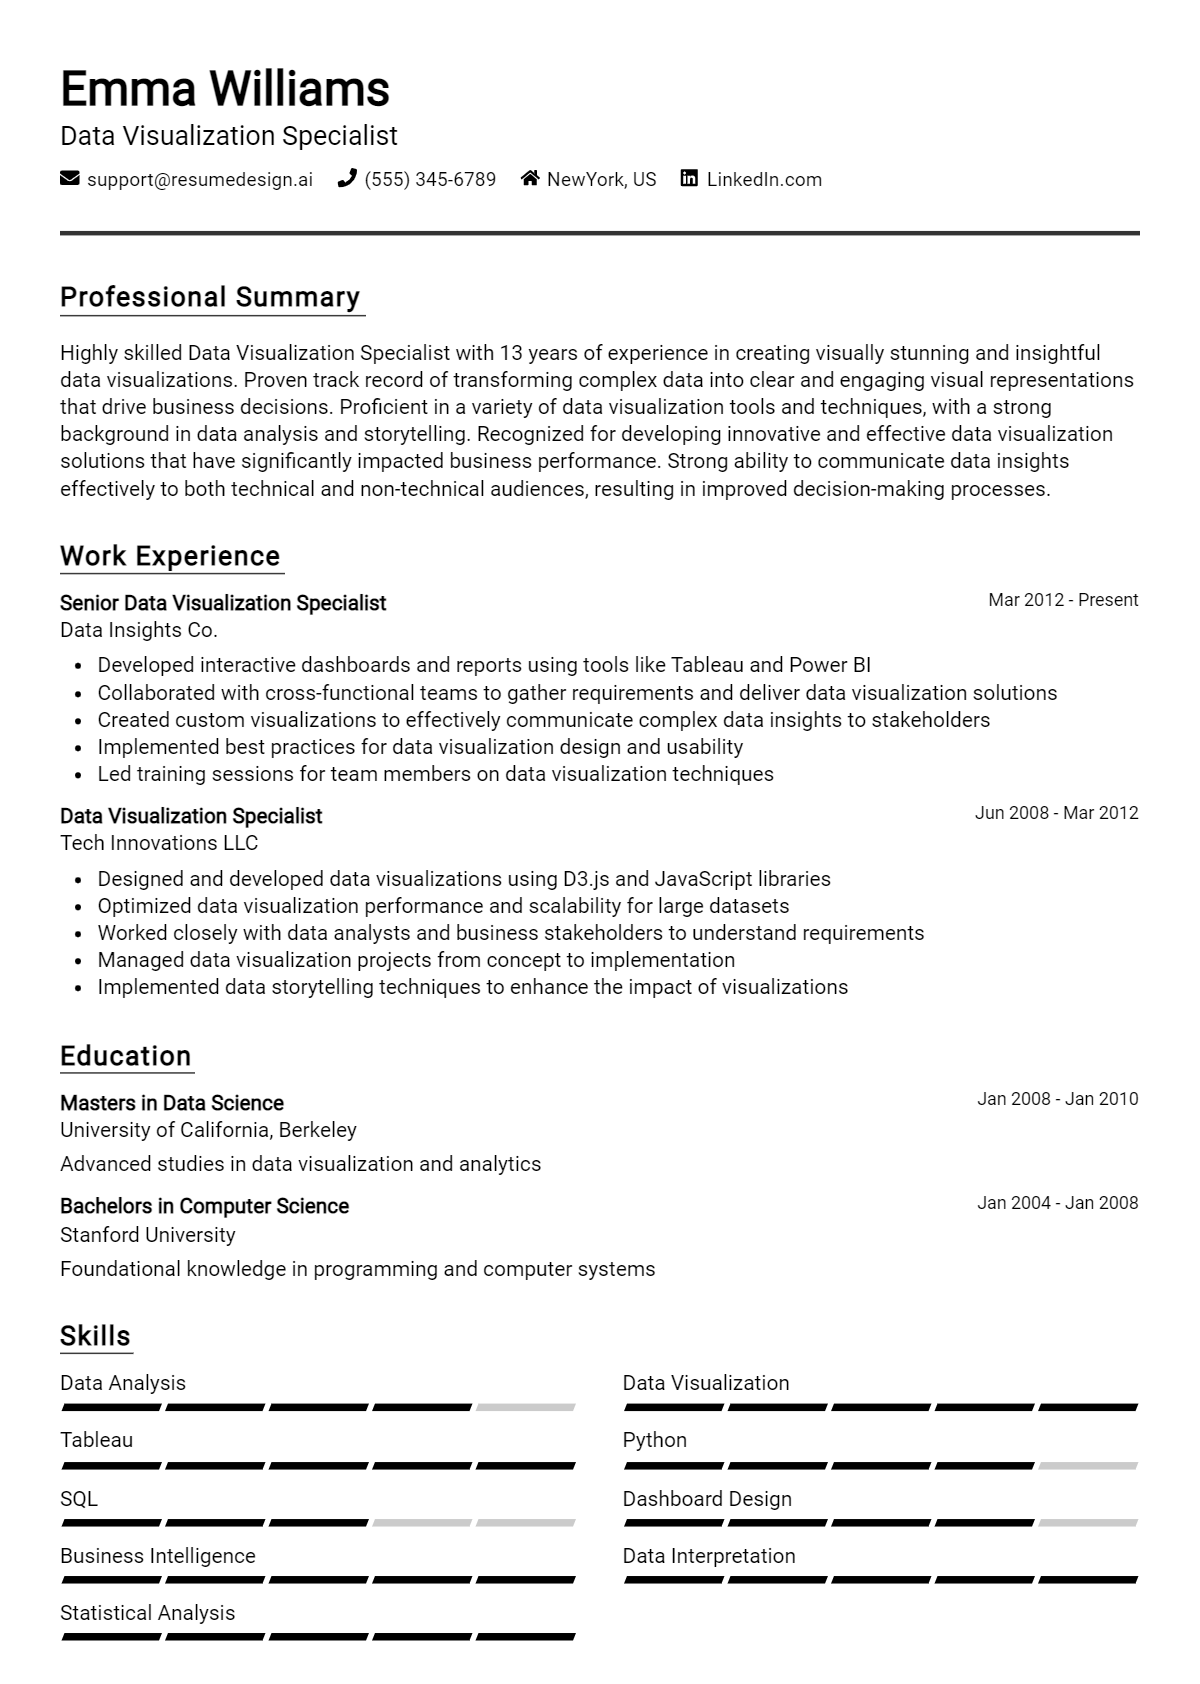
Data Visualization Specialist Core Responsibilities
A Data Visualization Specialist plays a crucial role in transforming complex data into clear, actionable insights that bridge various departments, such as marketing, finance, and operations. This professional possesses strong technical skills in data analysis and visualization tools, alongside operational expertise and problem-solving abilities. By effectively communicating data-driven narratives, they contribute to the organization's strategic goals. A well-structured resume showcasing these qualifications can significantly enhance a candidate's appeal in the competitive job market.
Common Responsibilities Listed on Data Visualization Specialist Resume
- Design and develop interactive dashboards to monitor key performance indicators.
- Analyze data sets to identify trends and patterns for strategic decision-making.
- Collaborate with cross-functional teams to gather requirements and deliver data solutions.
- Create visual reports that effectively communicate findings to stakeholders.
- Implement best practices for data visualization and storytelling.
- Maintain data integrity and ensure accuracy of visual representations.
- Utilize tools such as Tableau, Power BI, or D3.js for data visualization.
- Provide training and support to team members on visualization tools and techniques.
- Stay updated with industry trends and emerging technologies in data visualization.
- Optimize data visualization processes for efficiency and effectiveness.
- Conduct A/B testing of visualizations to enhance user experience.
- Document methodologies and processes for future reference and compliance.
High-Level Resume Tips for Data Visualization Specialist Professionals
In today's data-driven world, a well-crafted resume is essential for Data Visualization Specialist professionals seeking to make a lasting impression on potential employers. Your resume serves as the first point of contact, showcasing your unique blend of artistic flair and analytical prowess. It should not only highlight your technical skills but also reflect your achievements and contributions in previous roles. This guide aims to provide practical and actionable resume tips specifically tailored for Data Visualization Specialist professionals, ensuring that your application stands out in a competitive job market.
Top Resume Tips for Data Visualization Specialist Professionals
- Tailor your resume to the specific job description by incorporating relevant keywords and phrases.
- Highlight your experience with industry-standard visualization tools such as Tableau, Power BI, or D3.js.
- Quantify your achievements by using metrics, such as the percentage of increased efficiency or improved decision-making outcomes from your visualizations.
- Showcase your understanding of data analysis and interpretation by describing projects where you derived insights from complex datasets.
- Include a portfolio link to examples of your work, demonstrating your design skills and technical proficiency.
- Emphasize your collaboration with cross-functional teams, showcasing your ability to translate complex data into actionable insights for stakeholders.
- Mention any relevant certifications or training in data visualization or analytics to bolster your qualifications.
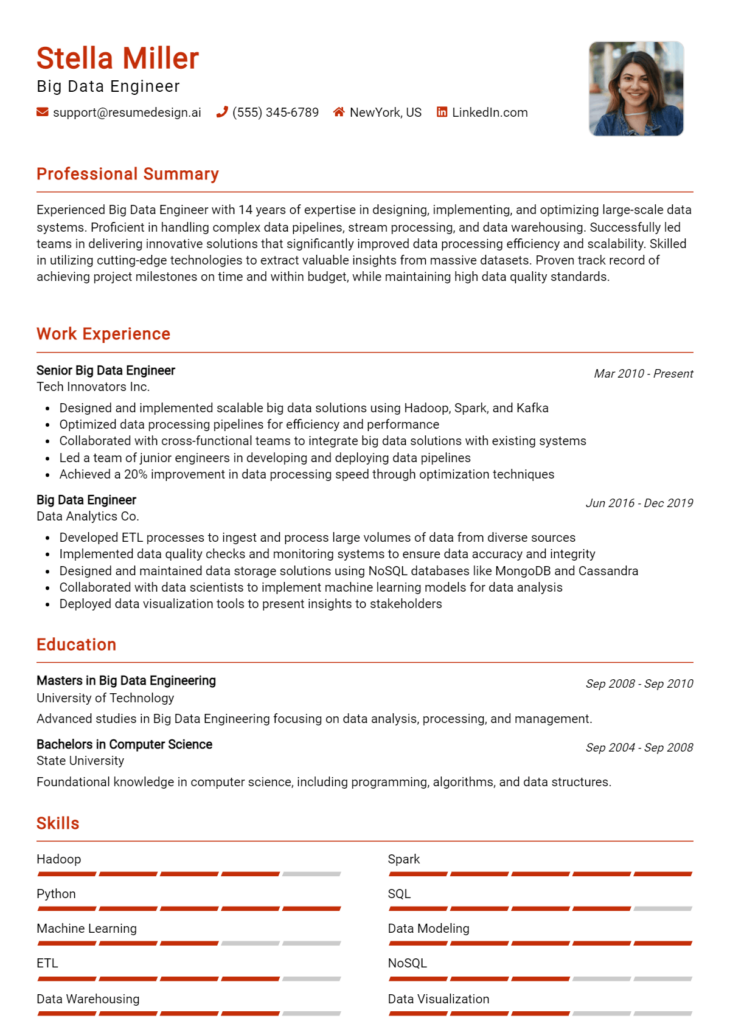
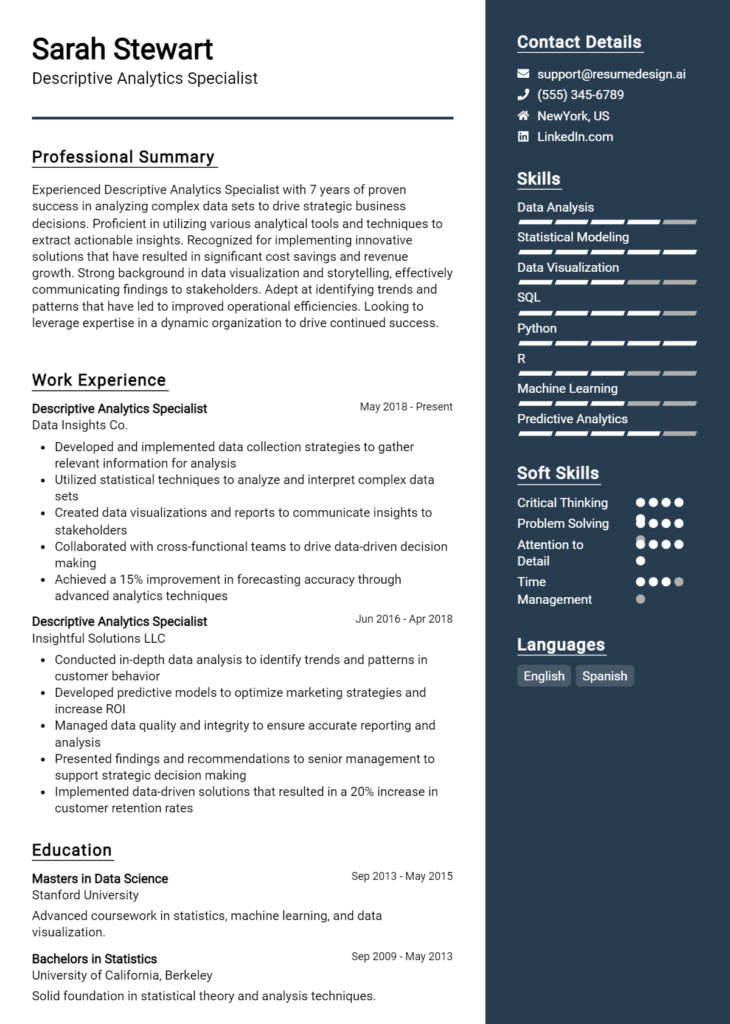
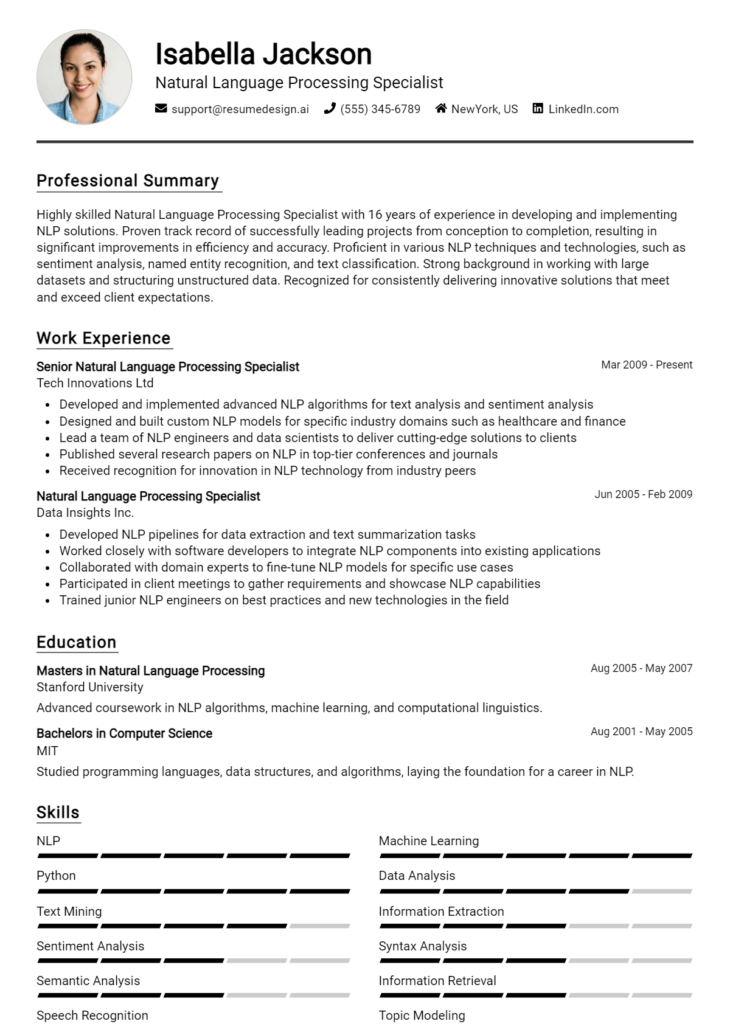
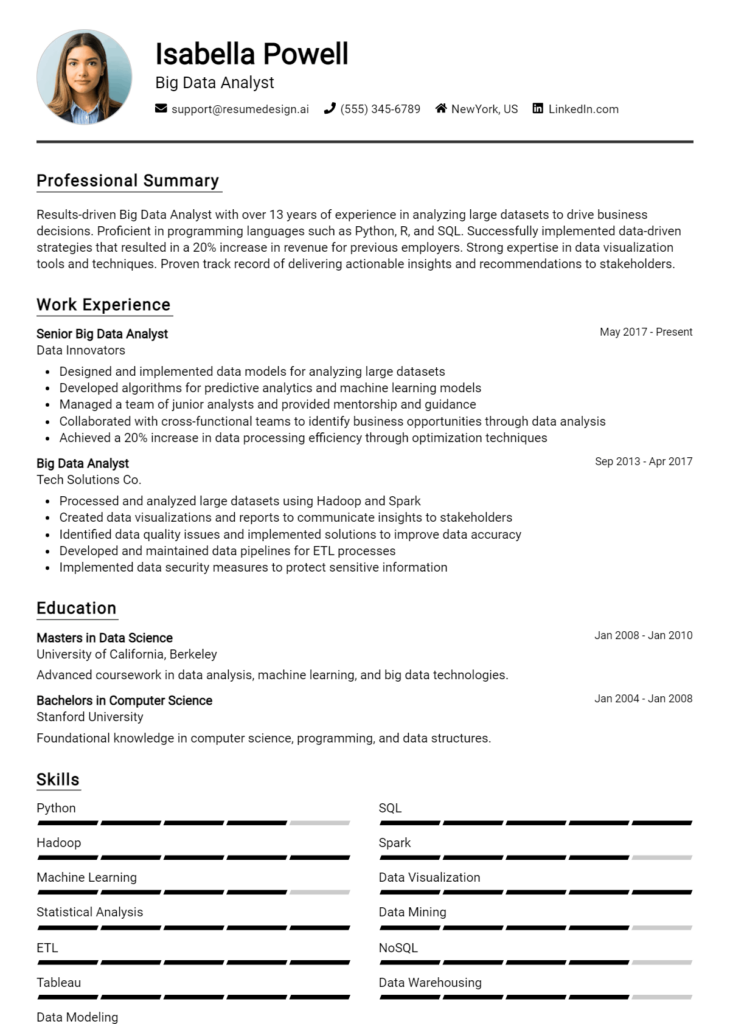
- Keep your layout clean and visually appealing, reflecting your design sensibility right from the resume format.
- Utilize bullet points for clarity and conciseness, ensuring that your key accomplishments are easily digestible.
- Proofread your resume for errors and inconsistencies, as attention to detail is crucial in data visualization roles.
By implementing these tips, you can significantly enhance your resume's effectiveness, increasing your chances of landing a job in the Data Visualization Specialist field. A polished and tailored resume not only showcases your skills and accomplishments but also communicates your professionalism and attention to detail, key traits that employers seek in this competitive landscape.
Why Resume Headlines & Titles are Important for Data Visualization Specialist
In the competitive field of data visualization, a well-crafted resume headline or title is essential for standing out to hiring managers. These brief phrases serve as a powerful introduction to the candidate's qualifications, summarizing their expertise and value in just a few words. An impactful headline can immediately capture attention, drawing the reader into the resume by highlighting specific skills or achievements relevant to the Data Visualization Specialist role. A strong headline should be concise, relevant, and tailored to the specific job being applied for, ensuring that the candidate's strengths are front and center from the very beginning.
Best Practices for Crafting Resume Headlines for Data Visualization Specialist
- Keep it concise: Aim for one impactful phrase that encapsulates your expertise.
- Be role-specific: Use terminology and keywords that directly relate to data visualization.
- Highlight key skills: Incorporate your most relevant skills, such as data analysis or tool proficiency.
- Showcase accomplishments: If possible, mention quantifiable achievements to demonstrate your impact.
- Use active language: Choose dynamic verbs that convey your proactive approach to data visualization.
- Tailor for each application: Customize your headline for each job to align with the specific requirements.
- Maintain professionalism: Ensure the tone reflects your expertise and fits the industry standards.
- Avoid jargon: While industry terms are important, keep the language accessible to a broader audience.
Example Resume Headlines for Data Visualization Specialist
Strong Resume Headlines
Expert Data Visualization Specialist with 5+ Years of Experience in Transforming Complex Data into Compelling Visual Stories
Data Visualization Expert Skilled in Tableau and Power BI, Driving Insights through Interactive Dashboards
Accomplished Data Analyst and Visualization Specialist with Proven Track Record of Enhancing Business Decision-Making
Weak Resume Headlines
Data Specialist
Experienced Professional
The strong headlines are effective because they clearly communicate the candidate's specific skills and contributions, making them relevant to the job at hand. By mentioning concrete tools and experiences, they present a compelling narrative that resonates with hiring managers. In contrast, the weak headlines lack specificity and fail to convey any meaningful information about the candidate’s qualifications, rendering them forgettable and unremarkable in a sea of applicants.
Writing an Exceptional Data Visualization Specialist Resume Summary
A resume summary is a critical component for a Data Visualization Specialist looking to stand out in a competitive job market. This concise introduction serves as a snapshot of the candidate's key skills, experience, and achievements, quickly capturing the attention of hiring managers. A strong summary not only highlights relevant capabilities but also aligns with the specific requirements of the job role, demonstrating the candidate's suitability for the position. By effectively summarizing qualifications in a compelling manner, candidates can create an impactful first impression that encourages further review of their resume.
Best Practices for Writing a Data Visualization Specialist Resume Summary
- Quantify Achievements: Use specific numbers and metrics to showcase the impact of your work, such as improved data reporting times or increased user engagement.
- Focus on Skills: Highlight key technical skills relevant to data visualization, such as proficiency in tools like Tableau, Power BI, or programming languages like Python and R.
- Tailor for the Job Description: Customize your summary to reflect the specific requirements and keywords found in the job posting.
- Be Concise: Keep your summary brief, ideally between 3-5 sentences, to ensure clarity and maintain the reader’s attention.
- Highlight Relevant Experience: Emphasize your experience in data analysis and visualization projects that directly relate to the job you are applying for.
- Showcase Soft Skills: Mention interpersonal skills that are valuable for collaboration, such as communication and teamwork, especially when presenting data findings.
- Use Action-Oriented Language: Start sentences with strong action verbs to create a dynamic and engaging summary.
Example Data Visualization Specialist Resume Summaries
Strong Resume Summaries
Data Visualization Specialist with over 5 years of experience creating interactive dashboards that increased data-driven decision-making by 30%. Proficient in Tableau and R, with a strong foundation in statistical analysis and data storytelling.
Results-oriented Data Visualization Expert with a track record of enhancing reporting processes, reducing data processing times by 25%. Skilled in SQL, Python, and Power BI, I excel at transforming complex datasets into actionable insights for stakeholders.
Creative Data Visualization Specialist with a passion for storytelling through data. Successfully implemented visual analytics solutions that improved user engagement by 40% in less than six months. Adept in data cleaning and manipulation using Python and Excel.
Weak Resume Summaries
Dedicated data professional with experience in visualization and analysis. I am looking for a challenging position in a dynamic company.
Data visualization specialist with skills in various tools. I am a team player and eager to learn more about data.
The examples of strong resume summaries effectively demonstrate quantifiable achievements, specific skills relevant to the role, and a clear alignment with the job requirements. In contrast, the weak summaries lack specificity and measurable outcomes, making them too generic and less impactful. A strong summary should engage the reader and make a compelling case for the candidate's capabilities, while weak summaries fail to capture interest or convey the candidate's qualifications effectively.
Work Experience Section for Data Visualization Specialist Resume
The work experience section of a Data Visualization Specialist resume is critical as it serves as a testament to the candidate's technical prowess, leadership capabilities, and commitment to delivering high-quality visual products. This section not only highlights the individual’s proficiency in data visualization tools and methodologies but also demonstrates their ability to manage teams and collaborate effectively with stakeholders. By quantifying achievements and aligning their experience with industry benchmarks, candidates can effectively illustrate their impact and value in previous roles, making them more appealing to potential employers.
Best Practices for Data Visualization Specialist Work Experience
- Clearly outline technical skills and tools used, such as Tableau, Power BI, or D3.js.
- Quantify achievements with specific metrics, like increased user engagement or reduced reporting time.
- Highlight collaborative projects, emphasizing cross-functional teamwork and communication.
- Use action verbs to convey impact and initiative, such as "developed," "implemented," or "led."
- Tailor experiences to align with job descriptions and industry standards.
- Include challenges faced and how they were overcome to demonstrate problem-solving skills.
- Showcase leadership roles in projects or teams to underscore management abilities.
- Incorporate feedback or accolades received to illustrate recognition for quality work.
Example Work Experiences for Data Visualization Specialist
Strong Experiences
- Led a team of 5 in creating an interactive dashboard that improved reporting efficiency by 40%, resulting in faster decision-making for stakeholders.
- Developed a data visualization strategy that increased user adoption by 30% within six months by enhancing usability and design aesthetics.
- Collaborated with marketing and data science teams to deliver a visual analytics tool that identified key market trends, resulting in a 20% increase in quarterly revenue.
- Implemented a new data visualization framework using Tableau that reduced data processing time by 50%, improving project turnaround times significantly.
Weak Experiences
- Worked on various data projects and created some reports.
- Assisted in data visualization tasks and participated in team meetings.
- Helped improve some dashboards but did not track results.
- Involved in team discussions about data but did not contribute significantly.
The examples provided above illustrate the difference between strong and weak experiences effectively. Strong experiences are characterized by specific achievements, quantifiable results, and clear descriptions of collaboration and leadership, demonstrating the candidate's direct impact on their projects. In contrast, weak experiences tend to lack detail, specificity, and measurable outcomes, making it difficult for potential employers to gauge the candidate's true capabilities and contributions.
Education and Certifications Section for Data Visualization Specialist Resume
The education and certifications section of a Data Visualization Specialist resume is crucial as it serves to showcase the candidate's academic background, relevant certifications, and commitment to continuous learning in a rapidly evolving field. This section not only highlights the formal education received but also emphasizes industry-recognized certifications and specialized training that can greatly enhance the candidate's credibility. By providing relevant coursework and professional development experiences, candidates can effectively align themselves with the specific requirements of the role, demonstrating both their expertise and dedication to utilizing data visualization tools and methodologies to inform decision-making and drive insights.
Best Practices for Data Visualization Specialist Education and Certifications
- Include only relevant degrees, such as those in Data Science, Statistics, Computer Science, or related fields.
- Highlight certifications from recognized organizations, such as Tableau, Microsoft, or Google, that are pertinent to data visualization.
- Be specific about relevant coursework, especially if it pertains to data analysis, visualization techniques, or programming languages.
- List any specialized training or workshops attended that are recent and relevant to current data visualization trends and tools.
- Use clear formatting to make it easy for hiring managers to quickly assess qualifications.
- Prioritize certifications that carry industry weight, such as Certified Analytics Professional (CAP) or similar credentials.
- Showcase any ongoing education efforts, such as online courses or webinars, to demonstrate commitment to staying current in the field.
- Consider adding a brief description of key projects undertaken during education that involved data visualization.
Example Education and Certifications for Data Visualization Specialist
Strong Examples
- Bachelor of Science in Data Science, University of XYZ, 2021
- Certified Tableau Desktop Specialist, Tableau, 2023
- Advanced Data Visualization Techniques, Coursera, 2022
- Master's Degree in Statistics, University of ABC, 2023
Weak Examples
- Associate Degree in General Studies, Community College, 2018
- Certification in Microsoft Office, 2020
- High School Diploma, 2016
- Outdated Certification in Basic Excel, 2019
The strong examples are considered effective because they demonstrate relevant educational qualifications and industry-recognized certifications that align with the responsibilities of a Data Visualization Specialist. They reflect a commitment to specialized training and continuous learning, showcasing the candidate's readiness for the role. Conversely, the weak examples are ineffective as they include outdated or irrelevant qualifications that do not contribute to the candidate's suitability for the position, thereby diminishing their competitive edge in the job market.
Top Skills & Keywords for Data Visualization Specialist Resume
As a Data Visualization Specialist, possessing the right skills is crucial for effectively transforming complex data into compelling visual narratives. A well-crafted resume that highlights both hard and soft skills not only showcases your technical expertise but also demonstrates your ability to communicate insights clearly and collaborate with cross-functional teams. In today’s data-driven world, the ability to convey information visually can set you apart from other candidates, making it essential to emphasize the relevant skills that align with the needs of potential employers. For more guidance on what skills to include, consider exploring this skills resource.
Top Hard & Soft Skills for Data Visualization Specialist
Soft Skills
- Analytical Thinking
- Attention to Detail
- Creative Problem Solving
- Communication Skills
- Collaboration and Teamwork
- Adaptability
- Time Management
- Critical Thinking
- Storytelling with Data
- User-Centric Design Mindset
Hard Skills
- Proficiency in Data Visualization Tools (e.g., Tableau, Power BI)
- Advanced Excel Skills
- Database Management (SQL)
- Familiarity with Programming Languages (e.g., Python, R)
- Data Cleaning and Preparation
- Understanding of Data Analysis Techniques
- Knowledge of Statistical Methods
- Experience with GIS Software
- Web Development Fundamentals (HTML/CSS/JavaScript)
- Familiarity with Cloud Computing Services (e.g., AWS, Google Cloud)
In addition to these skills, having relevant work experience in data visualization projects can further enhance your resume and showcase your practical application of these competencies.
Stand Out with a Winning Data Visualization Specialist Cover Letter
As a dedicated and detail-oriented Data Visualization Specialist, I am excited to apply for the position at [Company Name]. With a robust background in data analytics and a passion for transforming complex datasets into compelling visual stories, I am confident in my ability to contribute effectively to your team. My experience in utilizing visualization tools such as Tableau, Power BI, and D3.js has equipped me with the skills necessary to create intuitive and engaging dashboards that drive data-driven decision-making.
In my previous role at [Previous Company Name], I successfully collaborated with cross-functional teams to identify key performance indicators and develop interactive visualizations that highlighted trends and insights. One of my notable projects involved redesigning a reporting dashboard that improved stakeholders’ ability to track project progress and identify bottlenecks, resulting in a 30% increase in project efficiency. I thrive in fast-paced environments and have a proven track record of delivering high-quality visualizations while adhering to tight deadlines.
I am particularly drawn to [Company Name] because of your commitment to leveraging data for impactful solutions. I admire your innovative approach and believe my skills align well with your mission. I am eager to bring my expertise in data storytelling and visualization to your organization, ensuring that complex data is presented in a clear and actionable manner. I am excited about the opportunity to contribute to [specific project or initiative at the company] and help drive strategic insights through effective data visualization.
Thank you for considering my application. I look forward to the opportunity to discuss how my background and skills can complement your team at [Company Name]. I am enthusiastic about the possibility of contributing to your data-driven initiatives and helping to elevate your analytics capabilities.
Common Mistakes to Avoid in a Data Visualization Specialist Resume
When crafting a resume as a Data Visualization Specialist, it is crucial to present your skills and experience effectively to stand out in a competitive job market. However, many candidates make common mistakes that can undermine their chances of landing an interview. Avoiding these pitfalls will help you create a compelling resume that highlights your qualifications and expertise in data visualization.
Neglecting to Tailor the Resume: Failing to customize your resume for each job application can make you appear unfocused. Always align your skills and experiences with the specific requirements of the position.
Lacking Quantifiable Achievements: Simply listing job duties without showcasing your accomplishments can weaken your application. Use metrics to demonstrate the impact of your work, such as “increased report generation speed by 30%.”
Overloading with Technical Jargon: While it’s essential to showcase your technical skills, using excessive jargon can alienate hiring managers. Aim for clarity and ensure your resume is understandable to both technical and non-technical audiences.
Ignoring Visual Elements: As a Data Visualization Specialist, a visually appealing resume is critical. Avoid generic templates and instead incorporate elements that reflect your design skills, such as smart use of color and layout.
Inconsistency in Formatting: A disorganized or inconsistent format can detract from the professionalism of your resume. Maintain uniform font sizes, bullet styles, and spacing to enhance readability and presentation.
Omitting Soft Skills: Data visualization is not just about technical ability; it also requires communication and storytelling skills. Failing to highlight these soft skills can make your application less compelling.
Inadequate Portfolio Integration: As a Data Visualization Specialist, showcasing your work is vital. Don’t just mention your portfolio; provide links or attach samples of your visualizations to demonstrate your capabilities.
Neglecting Proofreading: Spelling and grammatical errors can create an impression of carelessness. Always proofread your resume multiple times or seek a second opinion to ensure it is polished and professional.
Conclusion
As a Data Visualization Specialist, your role is pivotal in transforming complex datasets into insightful visual stories that drive informed decision-making. Throughout this article, we explored the essential skills and tools that are vital for success in this position, including proficiency in visualization software, a solid understanding of data analysis, and the ability to communicate insights effectively. We also discussed the importance of staying updated with industry trends and continuously improving your technical abilities to enhance your visual storytelling.
Now that you have a clearer understanding of the qualifications and skills necessary for a successful career as a Data Visualization Specialist, it’s time to reflect on your own resume. Is it showcasing your strengths and experiences effectively? A well-crafted resume can make all the difference in landing your dream job.
We encourage you to take a moment to review your resume and consider utilizing available resources to enhance it. Explore our collection of resume templates to find a design that fits your style, or try our resume builder for a step-by-step approach to crafting your professional document. Additionally, check out resume examples for inspiration and ideas on how to present your skills and achievements. Don’t forget to complement your application with a polished cover letter by using our cover letter templates.
Take action now and ensure your resume reflects your qualifications as a Data Visualization Specialist, setting you on the path to success in your job search!

