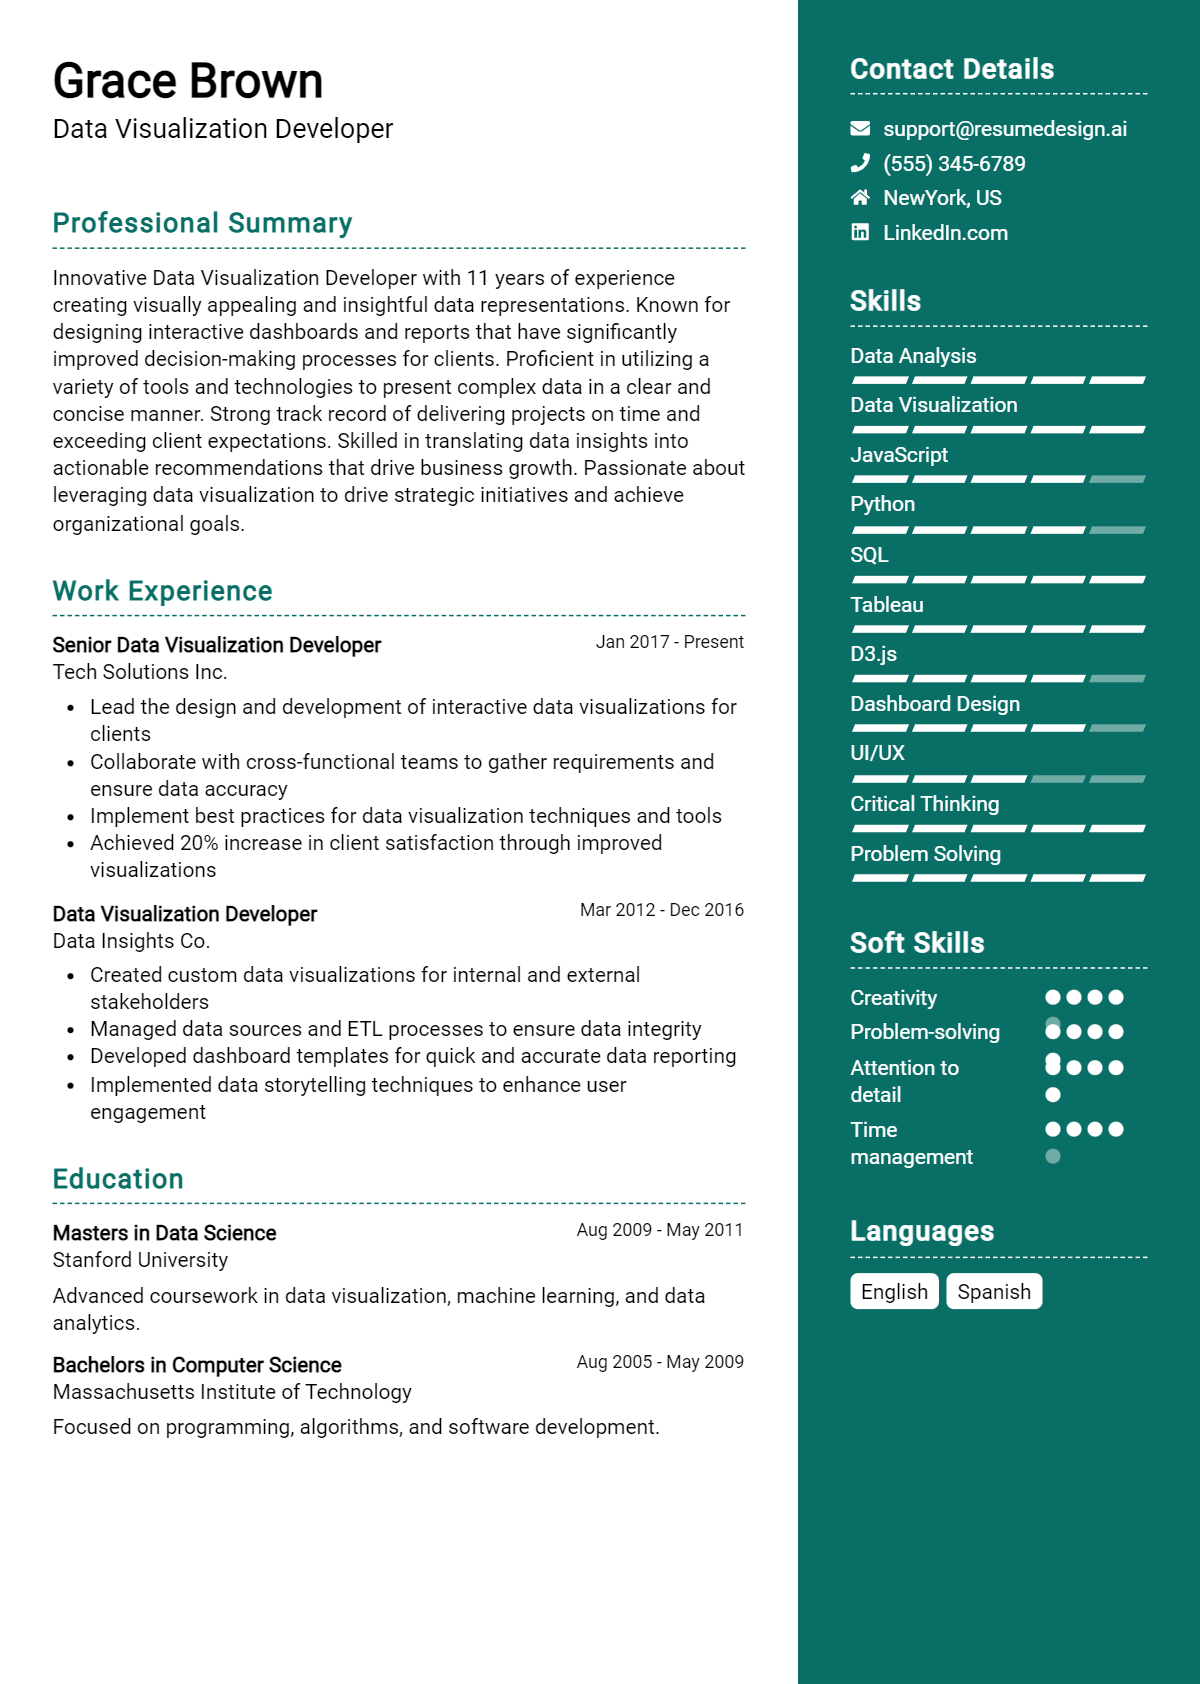
Data Visualization Developer Core Responsibilities
A Data Visualization Developer plays a crucial role in transforming complex data into visually appealing and insightful representations that facilitate decision-making across various departments. Key responsibilities include designing interactive dashboards, collaborating with stakeholders to identify data needs, and employing tools like Tableau or Power BI. Essential skills encompass technical proficiency in data manipulation, operational understanding of business processes, and strong problem-solving abilities. A well-structured resume highlighting these competencies can significantly enhance career prospects and contribute to the organization’s strategic objectives.
Common Responsibilities Listed on Data Visualization Developer Resume
- Design and develop interactive dashboards and reports.
- Collaborate with cross-functional teams to gather data requirements.
- Transform raw data into user-friendly visualizations.
- Analyze and interpret complex datasets to identify trends.
- Ensure data accuracy and integrity across visualizations.
- Utilize BI tools like Tableau, Power BI, or D3.js.
- Conduct user training sessions on data visualization tools.
- Stay updated with the latest data visualization trends and technologies.
- Optimize performance of existing visualizations for better user experience.
- Present findings and insights to stakeholders effectively.
- Develop and maintain documentation for visualization processes.
High-Level Resume Tips for Data Visualization Developer Professionals
A well-crafted resume is crucial for Data Visualization Developer professionals as it often serves as the first impression a potential employer has of a candidate. In a competitive job market, where technical skills and creative storytelling converge, your resume must effectively showcase not only your skills but also your achievements. It should reflect your ability to turn complex data into insightful visual narratives that drive decision-making. This guide will provide practical and actionable resume tips specifically tailored for Data Visualization Developer professionals, helping you stand out in a sea of applications.
Top Resume Tips for Data Visualization Developer Professionals
- Tailor your resume for each job application by aligning your skills and experiences with the job description to demonstrate your fit.
- Highlight relevant experience in data visualization tools and software, such as Tableau, Power BI, or D3.js, to showcase your technical expertise.
- Quantify your achievements by using metrics and percentages to demonstrate the impact of your work, such as increased efficiency or improved user engagement.
- Include a portfolio link to showcase your best visualization projects, providing tangible evidence of your skills and creativity.
- Utilize clear and compelling visuals in your resume layout to reflect your design capabilities, but ensure that the content remains easily readable.
- Emphasize industry-specific skills, such as data analysis, storytelling, and user experience design, that are essential for a Data Visualization Developer.
- Incorporate keywords from the job description to enhance your resume's visibility in Applicant Tracking Systems (ATS).
- Showcase collaborative skills by including examples of successful teamwork in projects, as data visualization often requires input from various stakeholders.
- Keep your resume concise, ideally one page, focusing on the most relevant experiences and skills to maintain the employer's attention.
By implementing these tips, you can significantly increase your chances of landing a job in the Data Visualization Developer field. A well-structured resume that effectively communicates your skills and achievements will not only capture the attention of hiring managers but also position you as a strong candidate for any data-driven role.
Why Resume Headlines & Titles are Important for Data Visualization Developer
In today's competitive job market, a well-crafted resume headline or title is crucial for a Data Visualization Developer. This brief, impactful phrase serves as the first impression for hiring managers, instantly summarizing a candidate's key qualifications and expertise. A strong headline not only captures attention but also conveys relevance to the specific role being applied for. It should be concise and directly reflect the candidate's skills and experience, making it easier for employers to gauge their fit for the position at a glance.
Best Practices for Crafting Resume Headlines for Data Visualization Developer
- Keep it concise: Aim for one impactful sentence that encapsulates your expertise.
- Be role-specific: Tailor the headline to align with the specific job description.
- Highlight key skills: Incorporate relevant skills that are in demand for the role.
- Use action-oriented language: Start with strong verbs to convey a sense of achievement.
- Avoid jargon: Use clear and accessible language to ensure understanding.
- Showcase accomplishments: Mention notable projects or results to demonstrate effectiveness.
- Include relevant certifications: If applicable, highlight any certifications that add value.
- Make it memorable: Use creative phrasing that stands out but remains professional.
Example Resume Headlines for Data Visualization Developer
Strong Resume Headlines
Data Visualization Developer with 5+ Years of Experience in Transforming Complex Data into Engaging Visual Stories
Creative Data Visualization Specialist Skilled in Tableau and D3.js to Drive Business Insights
Results-Driven Data Visualization Expert with a Proven Track Record of Enhancing Decision-Making through Interactive Dashboards
Weak Resume Headlines
Looking for a Job in Data Visualization
Data Professional
The strong headlines are effective because they clearly convey the candidate's unique strengths, relevant experience, and specific skills that align with the Data Visualization Developer role. They are designed to catch the eye of hiring managers by showcasing a clear value proposition. In contrast, the weak headlines fall flat due to their vagueness and lack of specificity; they fail to provide any meaningful insight into the candidate's qualifications, making it difficult for employers to assess their fit for the position.
Writing an Exceptional Data Visualization Developer Resume Summary
A resume summary is a critical component for a Data Visualization Developer, as it serves as the first impression a hiring manager will have of a candidate. An exceptional summary quickly captures attention by succinctly showcasing the candidate's key skills, relevant experience, and notable accomplishments. Given the competitive nature of the tech industry, a strong summary should be concise, impactful, and tailored specifically to the job being applied for. This ensures that the candidate stands out in a sea of applicants, clearly demonstrating their value and alignment with the role's requirements.
Best Practices for Writing a Data Visualization Developer Resume Summary
- Quantify Achievements: Use specific numbers or percentages to showcase your impact, such as improvements in data processing time or user engagement.
- Focus on Key Skills: Highlight relevant technical skills such as proficiency in tools like Tableau, Power BI, or programming languages like Python and R.
- Tailor to the Job Description: Customize the summary to reflect the specific requirements and keywords from the job listing to pass through Applicant Tracking Systems (ATS).
- Be Concise: Aim for 2-4 sentences that deliver maximum information in a brief format, avoiding unnecessary jargon.
- Include Industry Experience: Mention any relevant industry experience that aligns with the job, showcasing your understanding of sector-specific data challenges.
- Highlight Problem-Solving Skills: Illustrate your ability to turn complex data into actionable insights, emphasizing your analytical thinking.
- Showcase Collaboration: If applicable, mention your experience working in cross-functional teams to emphasize your ability to communicate findings effectively.
- Use Active Language: Employ strong action verbs to convey a sense of dynamism and proactivity in your work.
Example Data Visualization Developer Resume Summaries
Strong Resume Summaries
Data Visualization Developer with over 5 years of experience in transforming complex data into compelling visual narratives. Successfully increased user engagement by 30% through interactive dashboards and reports, leveraging tools like Tableau and D3.js.
Results-driven Data Visualization Specialist with a proven track record of enhancing operational efficiency by 25% through innovative data visualization solutions. Proficient in SQL, Python, and Power BI, with a passion for translating data into actionable insights.
Dynamic Data Visualization Developer skilled in designing and deploying data-driven solutions that improved decision-making processes for Fortune 500 clients. Achieved a 40% reduction in reporting time by creating automated visualization tools using R and Shiny.
Weak Resume Summaries
Experienced developer looking for a position in data visualization. I have some experience with charts and graphs.
Data professional seeking opportunities in data visualization. I enjoy working with data and have some programming knowledge.
The strong resume summaries provided are considered effective because they include specific achievements, quantify results, and highlight relevant skills that align with the role of a Data Visualization Developer. They convey a clear sense of impact and expertise, which is attractive to hiring managers. Conversely, the weak summaries lack detail and specificity, failing to demonstrate the candidate's qualifications or measurable outcomes, making them less compelling in a competitive job market.
Work Experience Section for Data Visualization Developer Resume
The work experience section of a Data Visualization Developer resume serves as a critical platform for candidates to demonstrate their technical skills and capabilities in the realm of data visualization. This section not only highlights a candidate's proficiency with visualization tools and data manipulation techniques but also showcases their ability to manage teams, collaborate effectively, and deliver high-quality products. By quantifying achievements and aligning their experience with industry standards, candidates can provide compelling evidence of their impact and value to potential employers.
Best Practices for Data Visualization Developer Work Experience
- Highlight relevant tools and technologies used in projects, such as Tableau, Power BI, or D3.js.
- Quantify your achievements with specific metrics, like increased efficiency or revenue growth.
- Emphasize collaboration with cross-functional teams, including data analysts and business stakeholders.
- Demonstrate your technical leadership by mentioning mentorship roles or leading project initiatives.
- Showcase your problem-solving skills by detailing challenges faced and solutions implemented.
- Align your experience with industry standards and best practices in data visualization.
- Include any certifications or training relevant to data visualization and analytics.
- Use action verbs to convey your contributions effectively and dynamically.
Example Work Experiences for Data Visualization Developer
Strong Experiences
- Led a team of data analysts to develop an interactive dashboard using Tableau, resulting in a 25% increase in data accessibility and decision-making speed for management.
- Implemented a data visualization project that analyzed customer behavior, which contributed to a 15% increase in targeted marketing campaign effectiveness.
- Collaborated with the engineering team to integrate real-time data feeds into visualization tools, enhancing operational efficiency by 30%.
- Mentored junior developers in data visualization techniques, improving team productivity and reducing project turnaround time by 20%.
Weak Experiences
- Worked on various data projects with little detail on outcomes or specific contributions.
- Assisted in creating charts and graphs without mentioning the tools used or the impact of the work.
- Participated in team meetings for data visualization discussions, but did not specify any leadership or results.
- Contributed to the data analysis process without defining the scope or significance of the projects.
The examples provided highlight a stark contrast between strong and weak experiences. Strong experiences are characterized by specific, quantifiable outcomes that demonstrate technical expertise, leadership, and collaboration. These experiences provide clear evidence of the candidate's impact on projects and the organization. Conversely, weak experiences lack detail and fail to convey substantial contributions, making it difficult for potential employers to assess the candidate's true capabilities and value in the field of data visualization.
Education and Certifications Section for Data Visualization Developer Resume
The education and certifications section of a Data Visualization Developer resume plays a crucial role in establishing the candidate's foundational knowledge and commitment to the field. It showcases the academic background that equips candidates with the necessary skills in data analysis, programming, and design principles, while also highlighting any industry-relevant certifications that reflect specialized expertise. Including relevant coursework, certifications, and specialized training not only enhances the candidate's credibility but also demonstrates a proactive approach to continuous learning, which is vital in the ever-evolving landscape of data visualization technologies and methodologies.
Best Practices for Data Visualization Developer Education and Certifications
- Focus on relevant degrees, such as Data Science, Computer Science, or Graphic Design.
- Include industry-recognized certifications, such as Tableau Certified Professional or Microsoft Certified: Data Analyst Associate.
- List relevant coursework that demonstrates competency in data visualization tools and techniques.
- Highlight any specialized training or workshops related to data visualization methodologies.
- Use clear formatting to make this section easy to read and visually appealing.
- Keep the information up-to-date, removing any outdated certifications or courses.
- Emphasize any academic honors or scholarships that relate to data visualization or analytics.
- Consider including online courses or bootcamps that are relevant to the role.
Example Education and Certifications for Data Visualization Developer
Strong Examples
- B.Sc. in Data Science, University of Technology, 2021
- Tableau Desktop Specialist Certification, 2022
- Coursework: Advanced Data Visualization Techniques, Data Storytelling, and User Experience Design
- Google Data Analytics Professional Certificate, 2023
Weak Examples
- B.A. in History, University of Arts, 2010
- Certification in Basic Microsoft Office Suite, 2015
- Coursework: Introduction to Philosophy
- Outdated Certification in Adobe Flash, 2010
The examples above are considered strong because they directly relate to the Data Visualization Developer role, showcasing relevant degrees, certifications, and coursework that align with industry standards. In contrast, the weak examples illustrate educational qualifications that are either unrelated or outdated, failing to demonstrate the necessary skills and knowledge required for a data visualization position. Strong examples reflect a clear commitment to the field and a solid foundation of relevant expertise, whereas weak examples lack relevance and do not contribute to the candidate's qualifications for the role.
Top Skills & Keywords for Data Visualization Developer Resume
A well-crafted resume is essential for a Data Visualization Developer, as it not only showcases your technical abilities but also emphasizes your soft skills, which are crucial for effective collaboration and problem-solving. In the field of data visualization, the ability to communicate complex data insights clearly and engagingly is just as important as the technical know-how required to create compelling visualizations. Employers look for a combination of hard and soft skills to ensure that candidates can not only develop stunning visuals but also work effectively within teams and understand the needs of stakeholders. This balance is key to demonstrating your value and capability in transforming data into actionable insights.
Top Hard & Soft Skills for Data Visualization Developer
Soft Skills
- Effective Communication
- Problem-Solving
- Critical Thinking
- Attention to Detail
- Creativity
- Team Collaboration
- Adaptability
- Time Management
- User-Centric Mindset
- Analytical Thinking
Hard Skills
- Proficiency in Data Visualization Tools (e.g., Tableau, Power BI, D3.js)
- Strong Knowledge of SQL and Databases
- Experience with Programming Languages (e.g., Python, R)
- Familiarity with HTML/CSS for Web-Based Visualizations
- Data Analysis Techniques
- Understanding of Data Warehousing Concepts
- Knowledge of Statistical Methods
- Experience with Data Cleaning and Preparation
- API Integration Skills
- Version Control (e.g., Git)
For a deeper exploration of the skills necessary for a successful Data Visualization Developer, consider how these abilities can enhance your work experience and make your resume stand out.
Stand Out with a Winning Data Visualization Developer Cover Letter
Dear [Hiring Manager's Name],
I am excited to apply for the Data Visualization Developer position at [Company Name] as advertised. With a robust background in data analysis and visualization, coupled with a passion for storytelling through data, I am eager to contribute to your team. My experience in utilizing tools such as Tableau, Power BI, and D3.js has equipped me with the skills necessary to transform complex data sets into engaging and actionable insights, which align perfectly with [Company Name]'s commitment to data-driven decision-making.
In my previous role at [Previous Company Name], I successfully led several projects where I collaborated with cross-functional teams to understand their data needs and deliver tailored visualization solutions. One of my notable achievements was developing an interactive dashboard that enabled stakeholders to track key performance indicators in real-time, resulting in a 20% increase in operational efficiency. This experience taught me the importance of not only creating visually appealing graphics but also ensuring that the insights derived from the data are accessible and actionable for all users.
I am particularly drawn to the innovative approach that [Company Name] takes towards data visualization and analytics. I admire your commitment to leveraging cutting-edge technologies to enhance user experience and drive business growth. I am eager to bring my technical expertise and creative problem-solving skills to your team, helping to create visual narratives that facilitate better understanding and engagement with data across the organization.
Thank you for considering my application. I look forward to the opportunity to discuss how my background, skills, and enthusiasms align with the goals of [Company Name]. I am excited about the possibility of contributing to your projects and helping to advance your data visualization initiatives.
Sincerely,
[Your Name]
[Your LinkedIn Profile]
[Your Contact Information]
Common Mistakes to Avoid in a Data Visualization Developer Resume
Crafting a compelling resume as a Data Visualization Developer is crucial to standing out in a competitive job market. However, many candidates make common mistakes that can hinder their chances of landing an interview. By avoiding these pitfalls, you can present a polished and professional resume that effectively showcases your skills and experience in data visualization. Here are some of the most frequent mistakes to watch out for:
Lack of Tailoring: Failing to customize your resume for each job application can result in a generic appearance. Tailor your experience and skills to align with the specific requirements of the job listing.
Overloading on Technical Jargon: While technical skills are important, using excessive jargon can alienate hiring managers who may not be as versed in specific tools or programming languages. Aim for clarity and simplicity.
Ignoring Design Principles: As a Data Visualization Developer, your resume should reflect your design skills. Neglecting layout, color schemes, and hierarchy can make your resume hard to read and unprofessional.
Not Including Quantifiable Achievements: Many candidates list responsibilities instead of accomplishments. Use metrics and specific examples to demonstrate the impact of your work, such as improved data storytelling or user engagement.
Using a One-Size-Fits-All Format: A standard resume format might not showcase your creativity or skills effectively. Consider using a visually appealing format that highlights your data visualization capabilities.
Failing to Highlight Relevant Tools and Software: Omitting key tools and software relevant to data visualization, such as Tableau, Power BI, or D3.js, can lead to missed opportunities. Ensure these are prominently featured.
Neglecting Soft Skills: While technical skills are essential, soft skills like communication, teamwork, and problem-solving can set you apart. Highlight these skills to demonstrate your ability to collaborate and convey insights effectively.
Inconsistent Formatting: Inconsistencies in font sizes, bullet points, and spacing can detract from the professionalism of your resume. Maintain a consistent format throughout to enhance readability and presentation.
Conclusion
As we conclude our exploration of the Data Visualization Developer role, it's essential to recap the key skills and attributes that make a successful candidate stand out. Proficiency in data analysis, a strong understanding of visualization tools such as Tableau and Power BI, and a knack for storytelling through data are crucial. Moreover, familiarity with programming languages, like Python or R, can significantly enhance your ability to manipulate and present data effectively.
Understanding the importance of user experience and interactivity in visualizations cannot be overlooked, as these elements are vital for engaging stakeholders and conveying insights clearly. Furthermore, keeping abreast of current trends in data visualization, such as the use of AI and machine learning, can give you a competitive edge in the job market.
Now is the perfect time to review and refine your Data Visualization Developer resume. Ensure that it reflects your skills, experiences, and achievements accurately. To assist you in this process, consider utilizing resources like resume templates, which can provide a professional layout, or a resume builder that guides you in crafting a compelling narrative of your career. Additionally, browsing through resume examples can spark ideas on how to present your qualifications effectively. Don’t forget to enhance your application with a striking cover letter template that complements your resume.
Take action today—revise your resume and position yourself for success in the ever-evolving field of data visualization!

